Saving R Graphics across OSs
Published: April 14, 2020
R is known for it’s amazing graphics. Not only {ggplot2}, but also {plotly}, and the other dozens of packages at the graphics task view. There seems to be a graph for every scenario. However once you’ve created your figure, how do you export it? This post compares standard methods for exporting R plots as PNGs/PDFs across different OSs. As R has excellent cross-platform capabilities, we may expect this to follow through to exporting graphics. But as we’ll see, this isn’t the case!
Saving Graphics
Suppose we create a simple {ggplot2} scatter plot
library("ggplot2")
g = ggplot(mtcars, aes(disp, mpg)) +
  geom_point()
But once created, how do you save the plot to a file? If you want to save the scatter plot as a PDF file, then the standard route is something like
pdf("figure1.pdf")
print(g)
dev.off()
The pdf() function is part of the {grDevices} package that comes with base R. When you call pdf(), R starts a graphics device driver for producing PDF files. The function dev.off() then closes the file driver.
The documentation page on the pdf() function is very detailed - see ?pdf. It highlights the tension between documentation for the developer and documentation for the user. The former cares about details, such as the fact that larger circles use a Bezier curve. But users just want to save a graph. I suspect that the vast majority of people using the pdf() function don’t really care about the details. They just want a PDF file that contains their plot!
There are other functions for creating PDF graphics. You could use Cairo::CairoPDF() or grDevices::cairo_pdf(). As you might gather, both of these functions use cairo graphics. Cairo is a 2D graphics library with support for multiple output devices. These R functions use the Cairo API. What’s not clear from the documentation is how the functions differ (but we’ll see differences later).
You can determine if you have Cairo capabilities via
capabilities()["cairo"]
#> cairo
#>  TRUE
Most standard systems have Cairo support. Part of the difficultly I found when writing this post is that graphic support in R has changed over the years. So it’s very easy to find blog posts that contains out-dated information, especially around Cairo.
A similar situation applies to PNG graphics. You can use the default graphics device
png("figure1.png")
print(g)
dev.off()
or you could specify the type via png(..., type = "cairo") or png(..., type = "cairo-png"). There’s also a relatively new package, {ragg} that can save graphics as PNGs.
Intuitively, these functions must produce different outputs - otherwise why have them. But what is the difference? Is it file size? Speed of creating graphics? Or something else.
Cross Platform
One of R’s outstanding features is that it is cross platform. You write R code and it magically works under Linux, Windows and Mac. Indeed, the above the code “runs” under all three operating systems. But does it produce the same graphic under each platform? Spoiler! None of the above functions produce identical output across OS’s. So for “same”, I going to take a lax view and I just want figures that look the same.
Cannoical Graphic
To create a test graphic, we first make some data
library("ggplot2")
set.seed(1)
df = data.frame(x = rnorm(1000), y = rnorm(1000))
Then create a graphic that has a few challenging aspects
ggplot(df, aes(x = x, y = y)) +
  # Anti-aliasing check
  geom_abline(intercept = 3, slope = 1, size = 3) +
  # Font check & newline
  geom_label(x = 2.5, y = -1,
             label = "This is italic text\n in Arial Narrow",
             family = "Arial Narrow",
             fontface = "italic", size = 6, label.size = 0) +
  # Font check
  theme_bw(base_family = "Times") +
  # Font check
  theme(axis.title = element_text(face = "italic"),
        plot.title = element_text( face = "bold"),
        plot.subtitle = element_text(face = "italic"),
        plot.caption = element_text(face = "plain")) +
  # Transparency
  geom_point(alpha = 0.4)
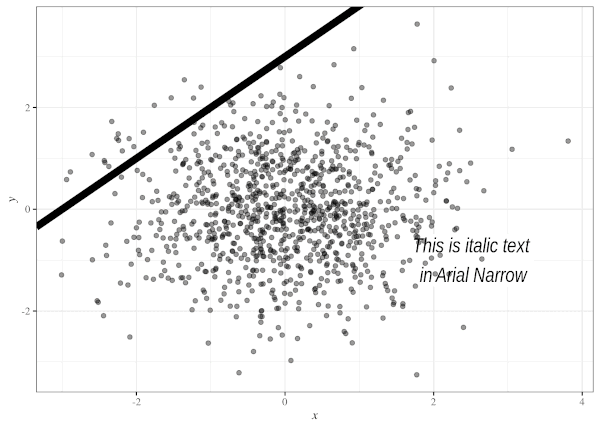
Many of the aspects of this test graphic have been taken from other blog posts. I’ve provided links at the end of this post
The Challenge
The above graphic was created under all three operating systems, using the graphics drivers listed above. The complete script can be downloaded from this GitHub gist. In this post, I don’t care about file size or the speed of the graphics device. As most use cases for R graphics don’t really depend on a few KB or an extra second generating the graph, this seems a reasonable compromise for this test. All tests were performed using R 3.6.3 or R 3.6.2.
grDevices::pdf()
All plots failed due to fonts. Interesting, the pdf version was 1.4, compared to 1.5 under other methods. Careful reading of the pdf() help page suggests this is expected behaviour due to non-standard fonts. From the documentation, I’m pretty sure I could embed the necessary fonts in the PDF file. However, it seems clear that there are differences between OSs, so my fix under Linux, might not be cross-platform. Also if we change font, the issue would appear again.
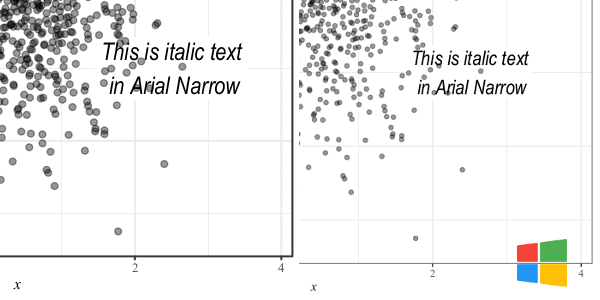
Cairo::CairoPDF()
Under all OSs, this function call executed without giving an error. However, there are severe font issues. The x on each plot is different and the text from geom_label() is different. Under Macs, it isn’t even in italics.
When we compare these graphics to the output from cairo_pdf() and the different png functions, it appears that the output from CairoPDF() is incorrect across all OSs.
Also, using the pdfinfo tool in Linux, each figure was created using a different version of Cairo: Windows (v1.10.2), Mac (v1.14.6) and Linux (v1.15.0).
grDevices::cairo_pdf()
All generated PDFs look the same, but are not identical! They again use different versions of Cairo (ranging from v1.14.6 to v1.16.0) and so have different file sizes.
If we compare Cairo::CairoPDF() to grDevices::cairo_pdf() under Windows, we can see the graphics created are significantly different.
Overall, if you are generating PDFs files then it’s clear you should use grDevices::cairo_pdf() if you want any chance of your code working across different OSs.
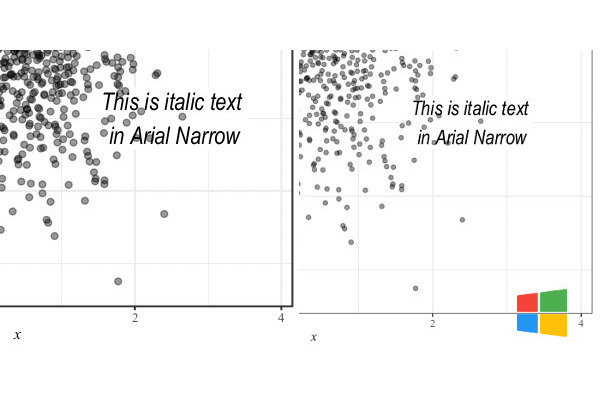
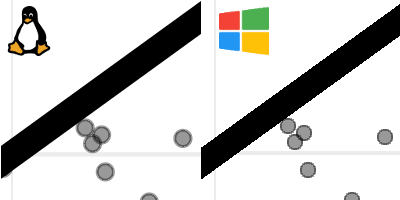
grDevices::png()
The png function produces graphics under Linux and Mac. However, the placement of the text is slightly different, e.g. a few pixels. Under Windows, the font appears to be the default and not Times or Arial.
Using the pnginfo tool also highlights that the three PNGs differ by
- Colour Type: Linux: paletted (256 colours) vs Mac: RGB vs Windows: paletted (156 colours)
- Channels: 1 vs 4 vs 1
Also under Windows, the graphic doesn’t use anti-aliasing. This is a technique for smoothing over pixels on straight lines. If we zoom into the line on Linux/Mac vs Windows we can see the “stair-case” effect.
grDevices::png(…, type = “cairo”)
All OSs produce a graphic that looks similar. But placement of text still differs by a few pixels between the OSs - but it’s barely visible. The axes line looks lighter under Mac and pnginfo indicates that colour type and channels differ.
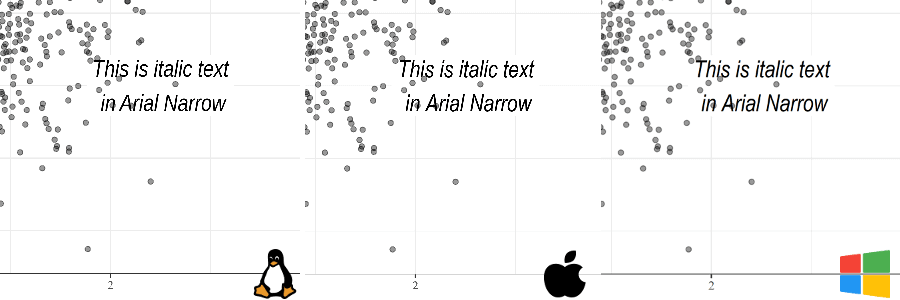
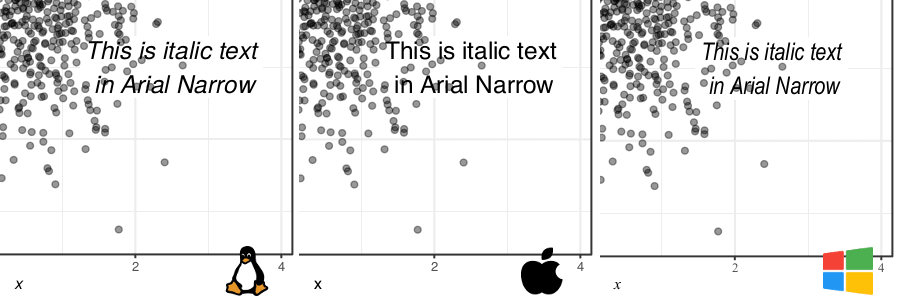
grDevices::png(…, type = “cairo_png”)
All OSs produce a graphic that looks similar and text placement appears (to the naked eye) to be identical. Using pnginfo indicates that colour type and channels are now the same.
The {ragg} package
Linux, Mac & Windows produced a graphic that looked similar and pnginfo indicates that all attributes were identical. However the linebreak in geom_label() uncovered a bug in the {ragg} package, which was fixed a few days later.
Conclusion
Overall, it appears that getting graphics to be identical across different OS’s is more difficult than one would first assume! For PDF plots, the least worst option is grDevices::cairo_pdf(), this doesn’t produce identical graphics as there are different versions of Cairo in play, but this test indicts the graphics are very similar. Frustratingly, you would typically save your bar/line/scatter plot as a PDF due to the superior resolution. But it also appears this isn’t particularly well suited to being cross-platform.
For PNG graphics, it’s clear you should always use the type = "cairo_png" with the png() function. However, I will be moving to the {ragg} package in the near future, especially as RStudio are incorporating it into their IDE. The quality and performance are impressive, and it’s goal is to produce identical cross-platform graphics.
See our latest blog post on setting graphics devices inside an Rmarkdown document, for details on how to use cairo within knitr.
Jumping Rivers are full service, RStudio certified partners. Part of our role is to offer support in RStudio Pro products. If you use any RStudio Pro products, feel free to contact us (info@jumpingrivers.com). We may be able to offer free support.
Links and thanks
This post used bits and pieces from a wide variety of sources. Hopefully, I’ve not forgotten anyone.
- This post actually started with an e-conversation with Bob Rudis four years ago, which resulted in this initial test.
- This post made me think about Cairo graphics.
- Another post on Cairo, with a look at anti-aliasing issues.
- Thanks to flaticon for nice OS images.
- A big thank you to Catherine Hurley for running the Mac tests.
- I don’t think I used this post, but I certainly read it. The post provides an excellent description for working with images and figures.