Github
LinkedIn
Twitter
YouTube
RSS

R Courses in Hamburg

Big news, from the 13th till the 27th June Jumping Rivers will be running 6 courses on R in Hamburg!!. It should be noted that each course runs for one day, apart from the Predictive Analytics course, which runs for 2 days. The courses are as follows: Introduction to R - 13th For this course, you need no prior programming knowledge of any type! You will learn how to efficiently manipulate, plot, import and export data using R.

eRum Competition Winners

The Main Competition The Secondary Competition What next? The results of the eRum competition are in! Before we announce the winners we would like to thank everyone who entered. It has been a pleasure to look at all of the ideas on show. The Main Competition The winner of the main competition is Lukasz Janiszewski. Lukasz provided a fantastic visualisation of the locations of each R user/ladies group and all R conferences.

The Water Hub Hackathon; We won!

Well well well, we’ve only gone and won The Water Hub hackathon! Well, joint winners but the main word is WINNER. First of all we want to say thank you to all the guys at the Water Hub and the Sunderland Software Centre for organising and inviting. There was some tough competition there and we are thrilled to have been ajudged joint top! Here’s how we won: The first day started off with presentations from Antonia Scarr and Matt Starr from the enviroment agency (who we apologise profusely to for constantly harassing about their current system and data), Martin Colling from the Wear Rivers Trust and Louise Bracken of The Water Hub.

Regular Expressions Every R programmer Should Know

Regular expressions. How they can be cruel! Well we’re here to make them a tad easier. To do so we’re going to make use of the {stringr} package install.packages("stringr") library("stringr") We’re going to use the str_detect() and str_subset() functions. In particular the latter. These have the syntax function_name(STRING, REGEX_PATTERN) str_detect() is used to detect whether a string contains a certain pattern. At the most basic use of these functions, we can match strings of text.

Which world leaders are twitter bots?

Set-up Getting the tweets Are world leaders actually bots? Set-up Given that I do quite like twitter, I thought it would be a good idea to right about R’s interface to the twitter API; {rtweet}. As usual, we can grab the package in the usual way. We’re also going to need the {tidyverse} for the analysis, {rvest} for some initial webscraping of twitter names, {lubridate} for some date manipulation and {stringr} for some minor text mining.

R & Python Machine Learning Courses

Hi there! We’re running some courses on R, Python and Tensorflow around the UK that you might be interested in! All courses are spearheaded with lectures by one of our first-class trainers. The lectures are interspersed with practicals and coffee breaks. Attendees get a set of in-depth notes to pair with the lecture. More details and information on prerequisite knowledge are available on our course description page. All participants must bring their own laptop.

Free ticket to eRum

So… big news. Jumping Rivers is sponsoring eRum 2018 and in light of this news we are giving away a free place at the conference! (Not to mention our very own lead consultant, Colin Gillespie, is one of the invited speakers.) The Main Competition Here at Jumping Rivers, we maintain the site meetingsR. This comprises of three comprehensive lists: All upcoming (and foregone) R conferences. All R useR groups from around the globe.

Our Logo In R

Hi all, so given our logo here at Jumping Rivers is a set of lines designed to look like a Gaussian Process, we thought it would be a neat idea to recreate this image in R. To do so we’re going to need a couple packages. We do the usual install.packages() dance (remember this step can be performed in parallel). install.packages(c("ggplot2", "ggalt", "readr")) We’re also going to need the data containing the points for the lines and which set of points belongs to which line.

Styling Base R Graphics

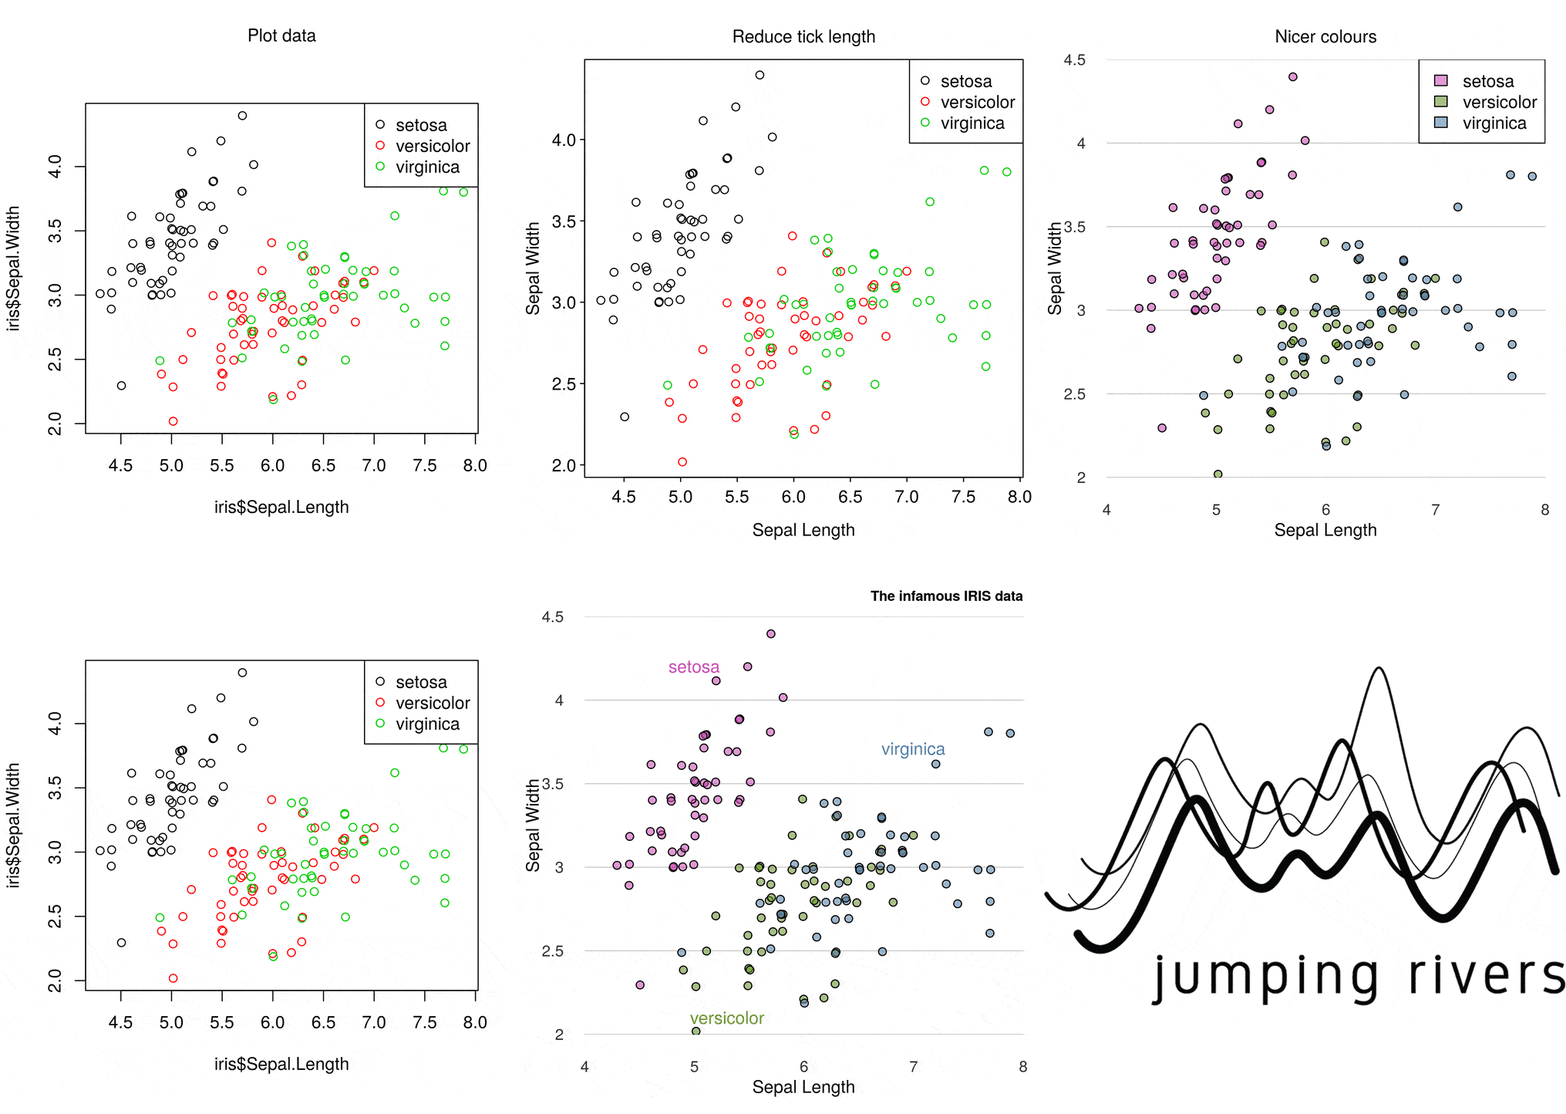
Publication quality base R graphics Fixing the problem Why not use {ggplot2} (or something else)? Publication quality base R graphics Base R graphics get a bad press (although to be fair, they could have chosen their default values better). In general, they are viewed as a throw back to the dawn of the R era. I think that most people would agree that, in general, there are better graphics techniques in R (e.

StanCon 2018 Highlights

This year we had the privilege of sponsoring StanCon. Unfortunately, we weren’t able to actually attend the conference. Rather than let our ticket go to waste, we ran a small competition, which Ignacio Martinez won with his very cool (but in alpha stage) R package. Highlights from StanCon 2018 During my econ PhD I learned a lot about frequentist statistics. Alas, my training of Bayesian statistics was limited. Three years ago, I joined @MathPolResearch and started delving into this whole new world.